Infographics library
Resources for seeing our impact and aims at a glance
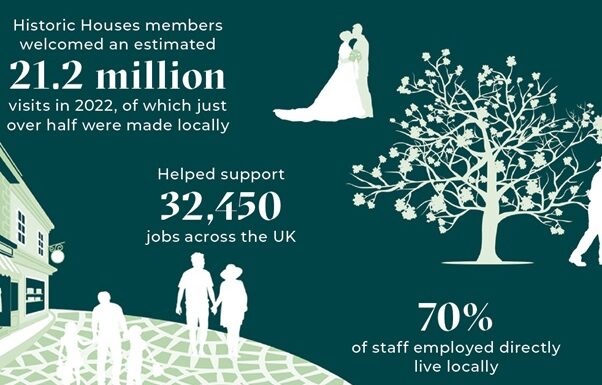
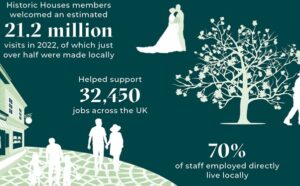
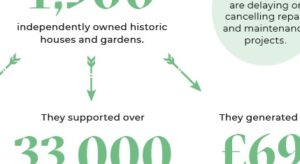
Key stats
The impact of historic houses in numbers
Download our latest key stats infographic to see what our member places contribute.
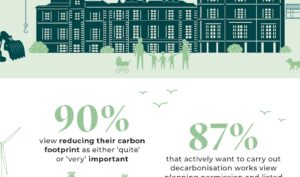
How planning reform could help heritage reach net zero
The greenest building is the one already built
Download our latest planning infographic to see the key findings from the Historic Houses member surveys.
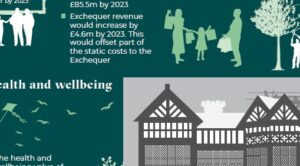
Fit for the Future
How HMF reform could unlock the power of historic houses
Download our Fit for the Future infographic to see the key findings from the Historic Houses member surveys.
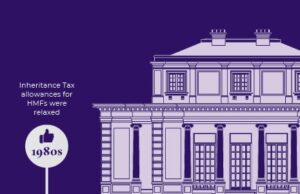
Tax timeline
How we see tax reform unfolding
Download our Tax timeline infographic to see the key findings from the Historic Houses member surveys.
2022 Policy Card
Our priorities for 2022 onwards
Read our UK-wide policy card to see our propose targeted policies that would provide our heritage attractions and regional economies with the boost they need to ensure a full recovery from the pandemic, but also put them on a more secure and resilient footing for years to come.